

Presentation demo
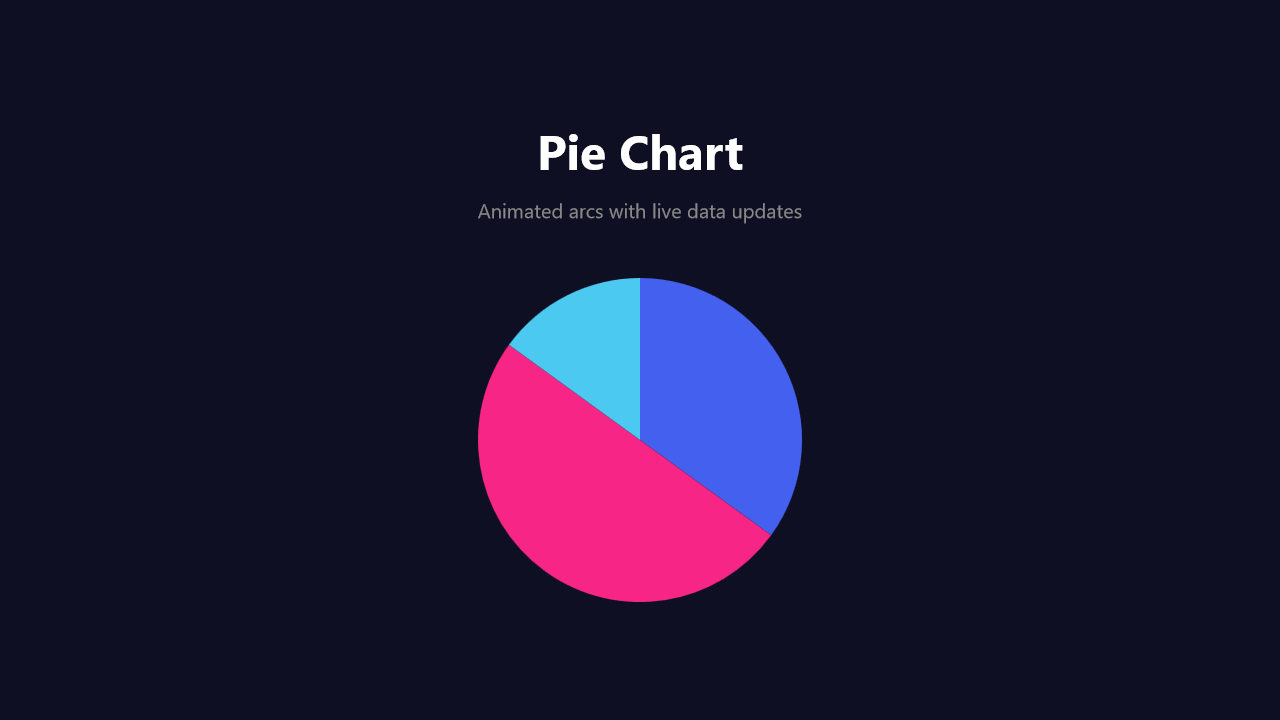
Cue-driven slides combine transitions, morphing, and live chart updates in one presentation flow.
Sample file
- Source:
samples/story/presentation-demo.story.yaml - Gallery frame:
10.5sfrom the baked29.82ssample.
Checked-in YAML
Deterministic excerpt from the checked-in sample: lines 177-272 cover the cue boundary and pie-chart slide shown in the gallery frame. Use the direct source link for the complete multi-slide deck.
yaml
  - cue:

  # ═══════════════════════════════════════════════════════════════
  # SLIDE 3 — Pie Chart  (← diagonal sweep from bottom-right)
  # ═══════════════════════════════════════════════════════════════

  - create@bg3:
      rect: null
      width: 1480
      height: 920
      fill: "#0f0f23"
      x: 1380
      y: 820

  - set:
      bg3.x: -100
      bg3.y: -100
    with:
      spring: 0.8, 12

  - wait: settle

  - create@title3:
      text: "Pie Chart"
      fontSize: 48
      fontFamily: "Segoe UI"
      fontWeight: bold
      color: "#ffffff"
      x: 640
      y: 150
      align: center
    with: $smooth

  - create@sub3:
      text: "Animated arcs with live data updates"
      fontSize: 20
      fontFamily: "Segoe UI"
      color: "#888888"
      x: 640
      y: 210
      align: center
      opacity: 0

  - destroy: $shape
  - destroy: $title2
  - destroy: $sub2

  - wait: 0.15s

  - set:
      sub3.opacity: 1
    with: $smooth

  # Pie chart — radius animates from 0 to reveal
  - create@pie:
      pie:
        - Frontend: 350
          color: "#4361ee"
        - Backend: 500
          color: "#f72585"
        - DevOps: 150
          color: "#4cc9f0"
      x: 640
      y: 440
      radius: 0
      align: center

  - set:
      pie.radius: 160
    with:
      spring: 0.6, 10

  - wait: settle
  - wait: 0.5s

  # Insert a new slice
  - data: $pie
    insert:
      - Mobile: 280
        color: "#e9a560"
    with:
      spring: 0.8, 12

  - wait: settle
  - wait: 0.3s

  # Update existing data
  - data: $pie
    update:
      - Frontend: 600
    with:
      spring: 0.8, 12

  - wait: settle

  - cue:
Mechanics walkthrough
- A bare
cue:marks a presentation checkpoint. Preview can auto-run past it, andstory livecan pause on it for an interactive deck flow. - The pie chart slide creates
piedata at radius0, springs it open, inserts a new slice, and then updates an existing slice without replacing the chart object. - The gallery frame at
10.5slands after the pie has appeared and before the later chart updates finish, so the still is stable but still clearly in the data-presentation phase.
Preview and export
powershell
story live samples\story\presentation-demo.story.yaml
story preview samples\story\presentation-demo.story.yaml
story export samples\story\presentation-demo.story.yaml --auto-cue 3
story frame samples\story\presentation-demo.story.yaml --time 10.5 -o docs\public\images\examples\presentation-demo.png